MAQ Index 2026 | 22nd Edition
Risk Doesn't Disappear.
It Gets Passed Along.
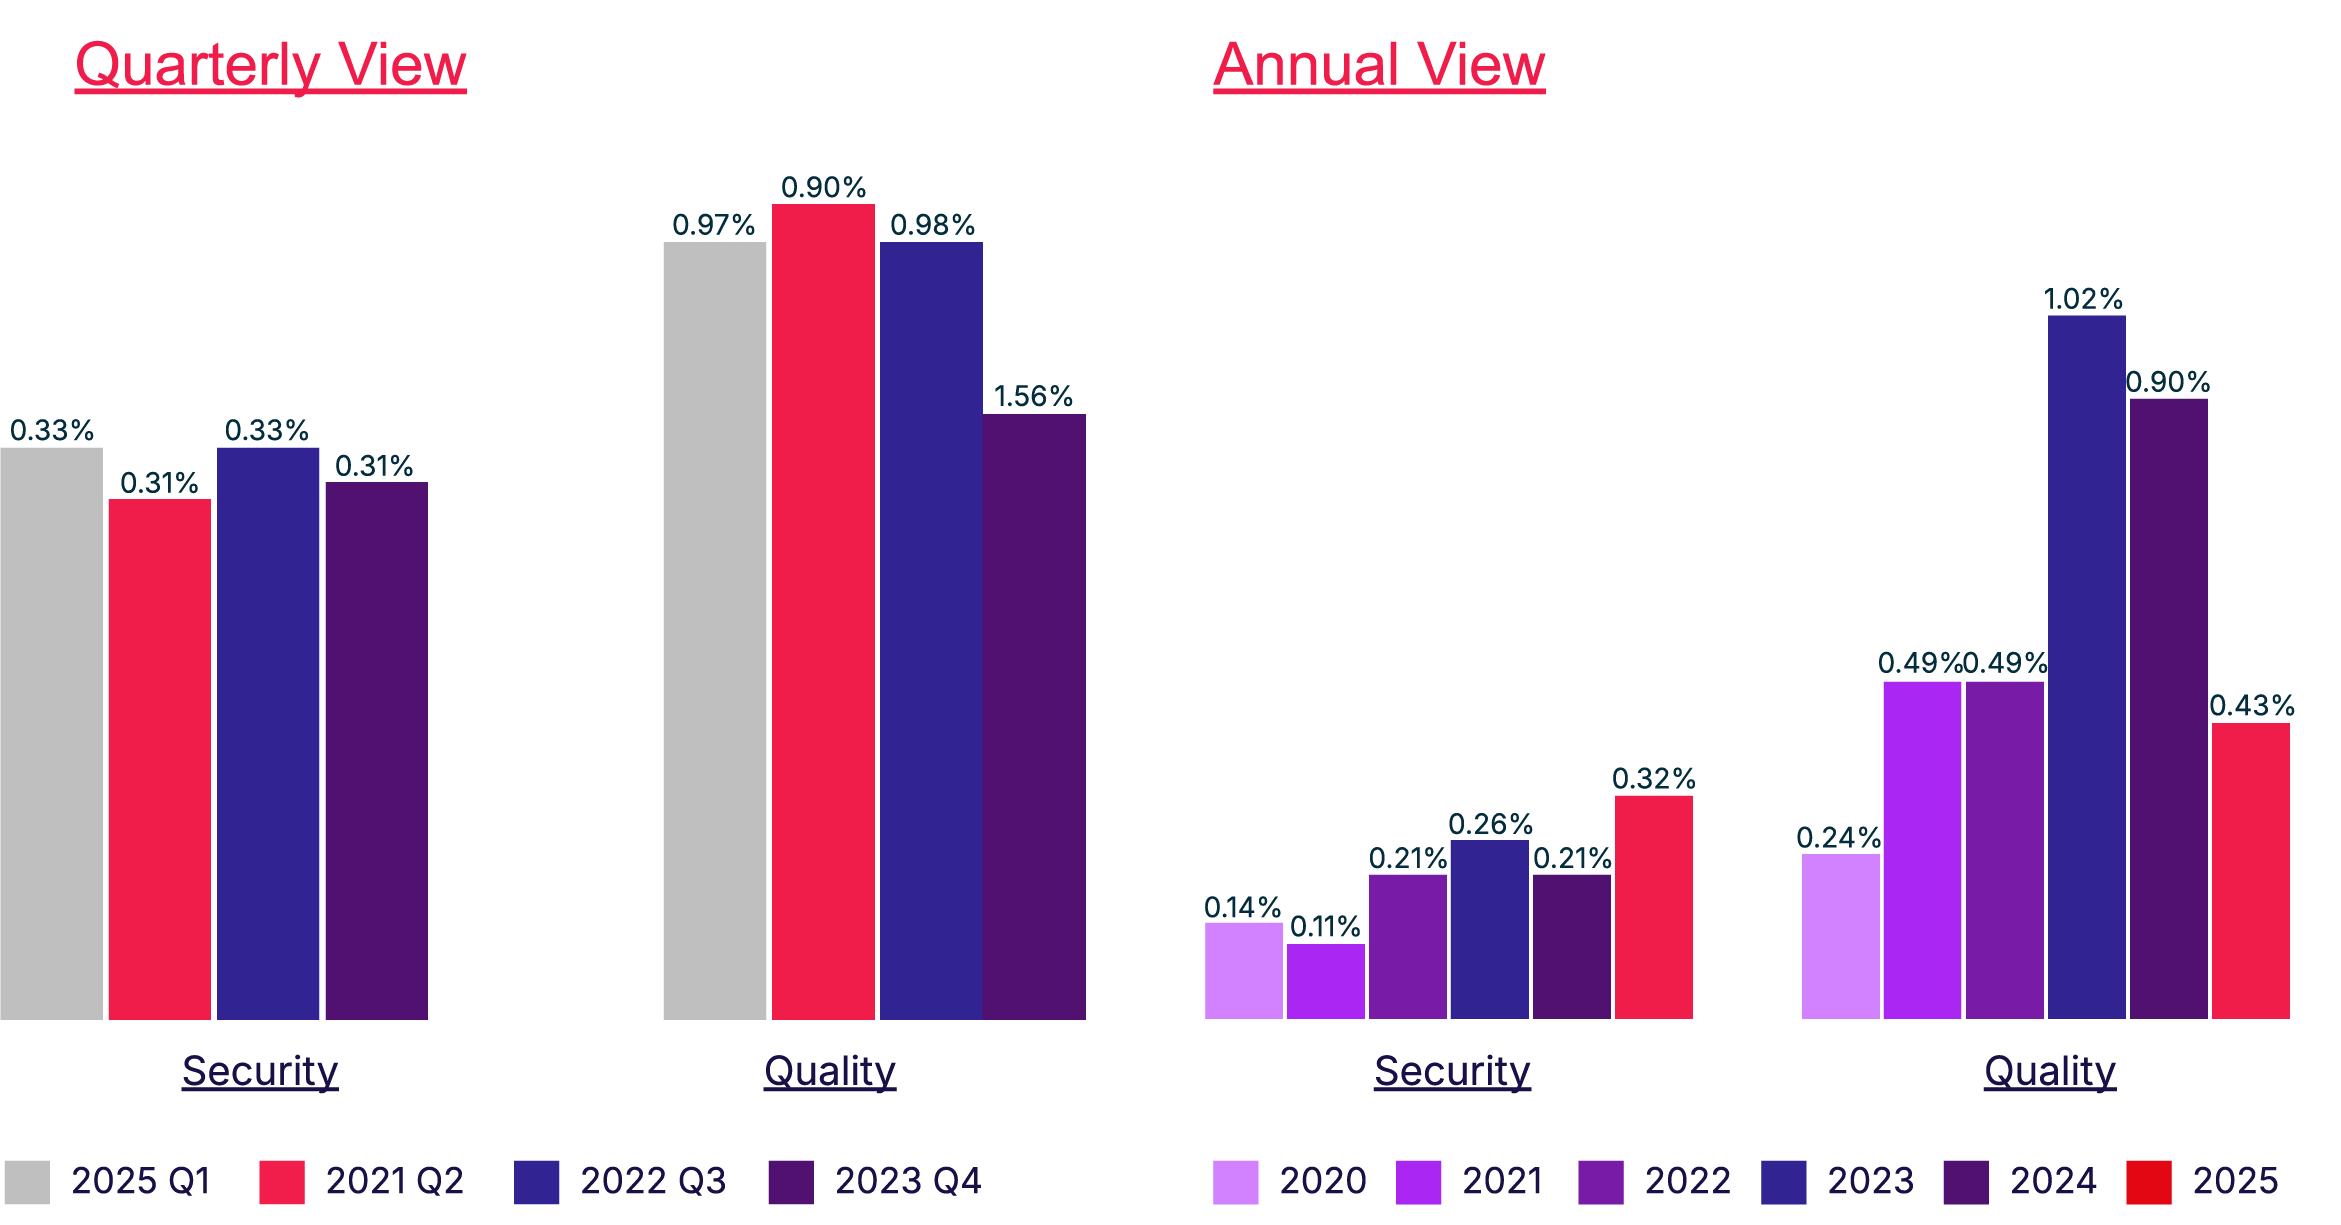
One in every 133 impressions delivered across premium inventory was dangerous or highly disruptive to the end user. The 2026 MAQ Index examines where risk enters the ad economy, how it moves through the system, and what it ultimately costs in revenue, operational overhead, and user trust. Findings are based on observations from the 2025 reporting period.
What's Inside
Four Reports. One Complete Picture.


Download the 2026 MAQ Index
The most comprehensive annual study of creative quality and security risk in programmatic advertising. 1 trillion impressions. 13 platforms. Six threat categories.