
John Murphy • 2 minute read

Key Takeaways
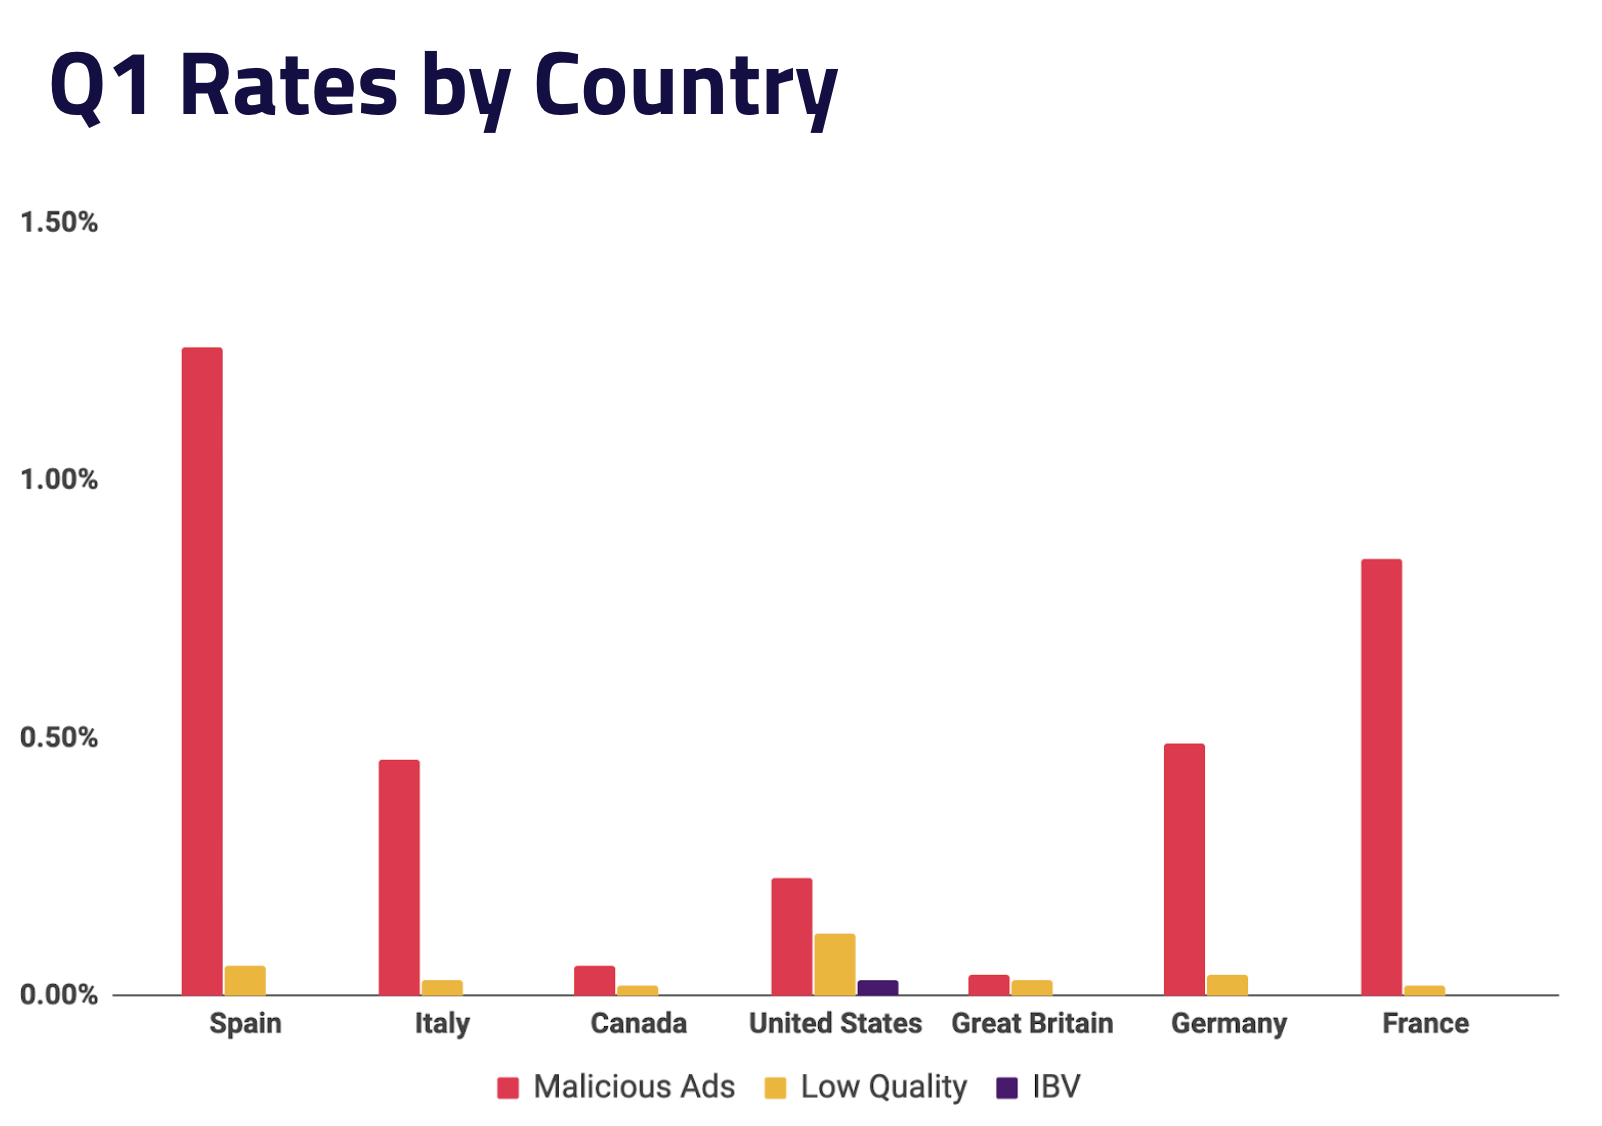
- European markets saw far higher rates of Malicious ads than the U.S.
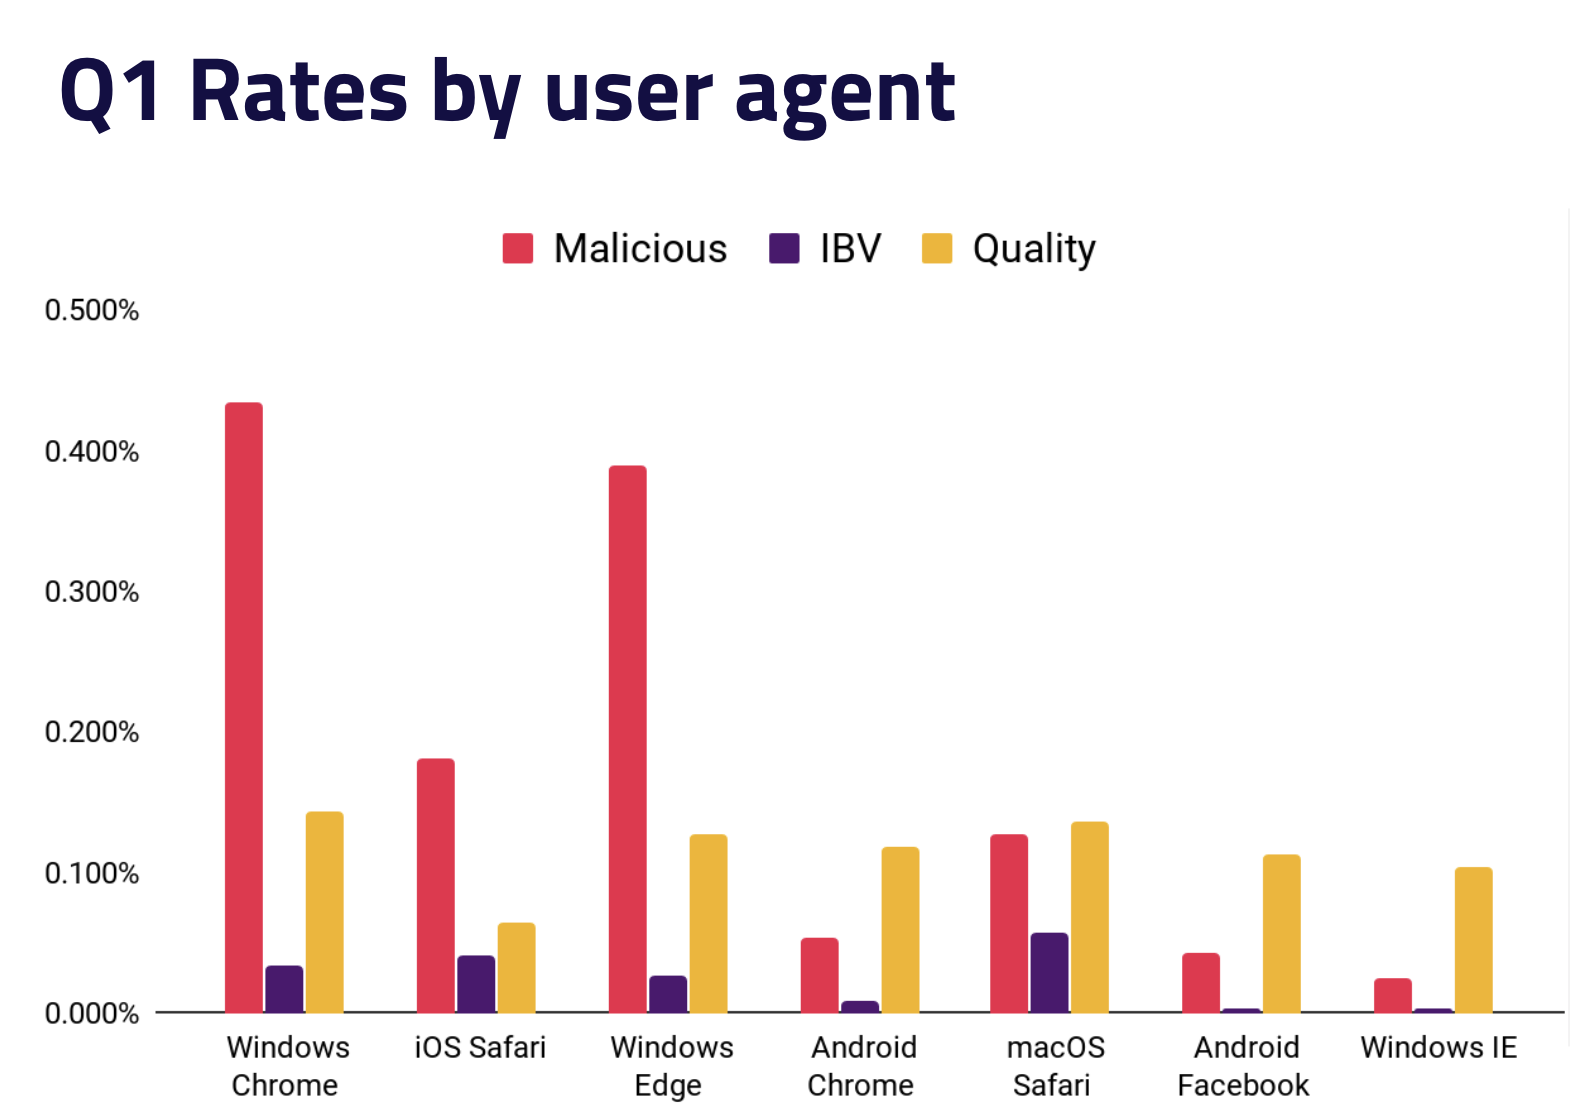
- We observed high malicious ad rates for the Chrome and Edge browsers on Windows OS
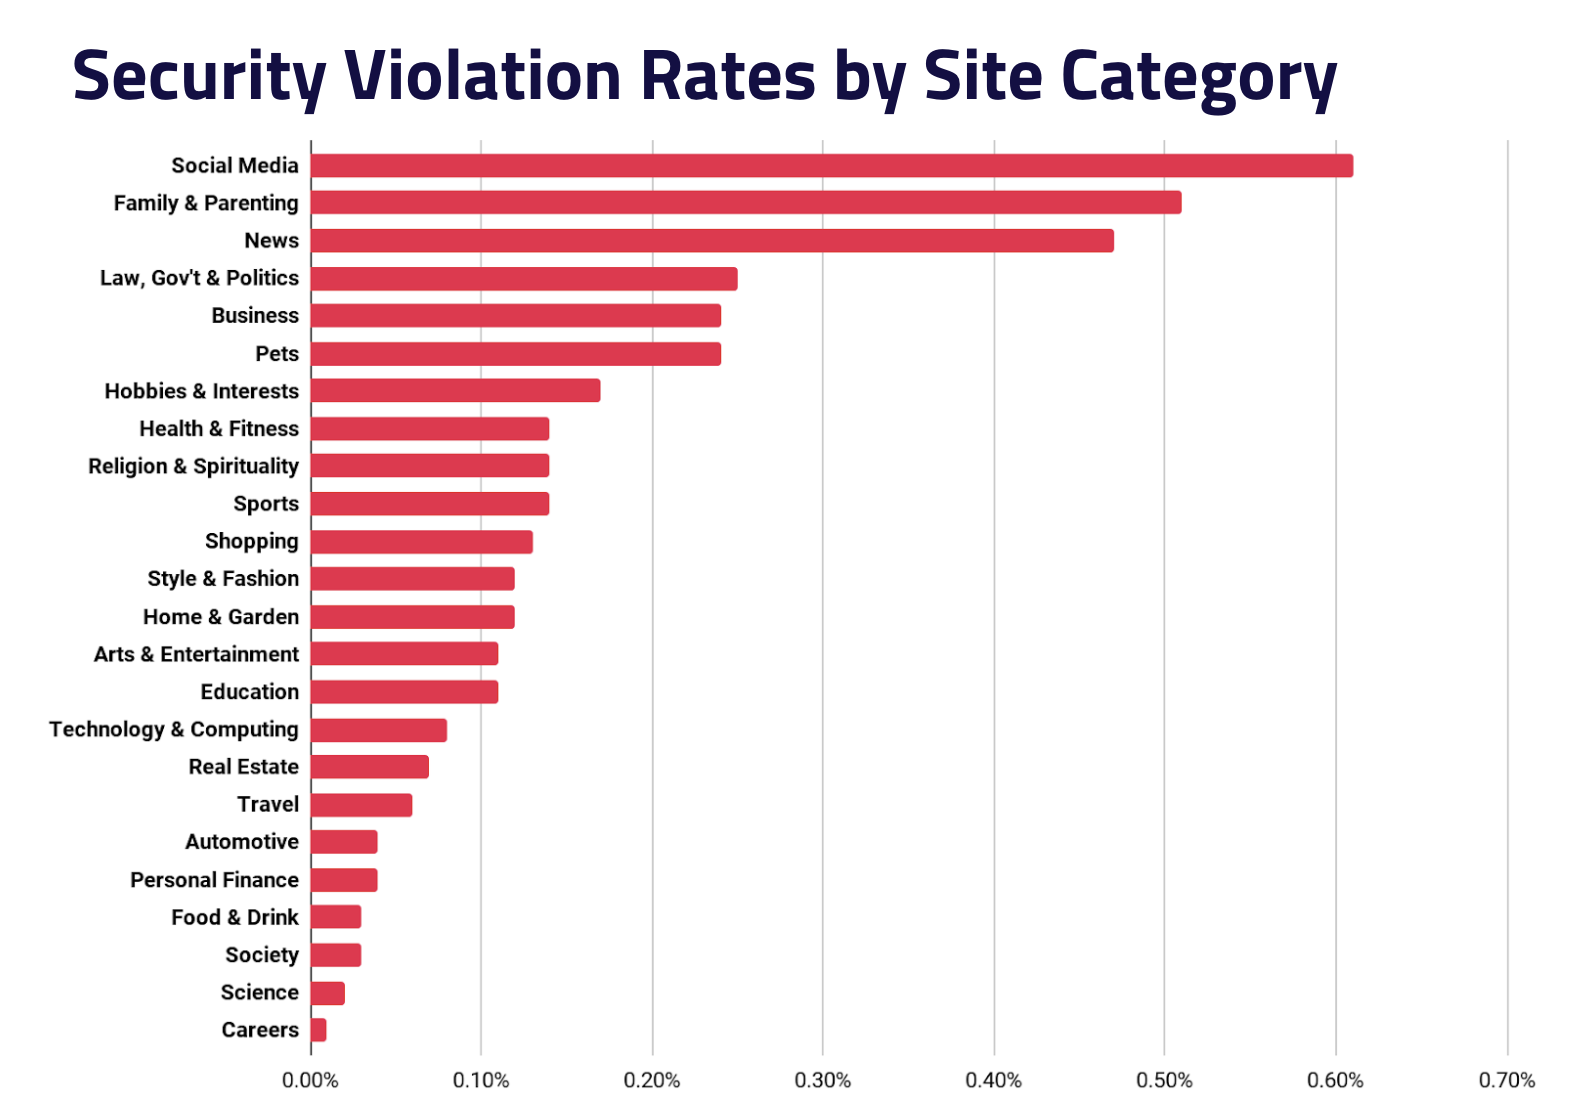
- Social Media sites were most at risk of security issues
With the release of our latest demand quality report, our goal is to help you understand the security and quality risks associated with programmatic advertising in Q1 2020.
Using a sample of over 200 billion impressions monitored by our real-time verification solution on over 30,000 sites and apps, we are able to provide you with key insights on the state of ad quality.

One of the most frequently asked questions we get from publishers is, “where are malicious attacks coming from?” This makes sense as many publishers are seeking to understand the problem at a deeper level and take proactive steps to protect their audience. Answering this question can be challenging due to the highly dynamic nature of digital advertising and the speed with which threat actors adapt. However, our security team’s mission is to understand attack patterns and techniques and attribute attacks to specific threat actors. This blog post will briefly dive into 3 characteristics of an attack: what countries did the campaign target, which platforms and OS were most vulnerable; and what site categories are malvertisers most interested in.
Malicious Ads by Country, Platform, and Site Category
The rate of malicious impressions increased slightly from Q4 2019 to Q1 2020, with European markets seeing the greatest impact (see chart below). Many of these attacks can be associated with an emerging threat actor we’ve named Nephos7, who has undermined publisher security in Europe with massive waves of campaigns that saw 500MM compromised impressions. A different threat actor we call FizzCore also showed strong activity in the UK and Germany, relying on fake celebrity-endorsed news articles to lure users into their bitcoin scam. The variety of rates by country demonstrates how malvertisers continually shift their campaigns and targets to remain under the radar.
Just as campaigns can be targeted by country, they can also be targeted by device, operating system, or browser. Malvertisers seek to exploit security vulnerabilities to evade detection and will shift their attacks to maximize their chance of success. In 2019, iOS Safari had the highest rate of malicious ads. But moving into 2020, we are seeing a significant increase in malicious ad rate on the Chrome and Edge browsers for Windows.
Lastly, by being integrated into a wide variety of publisher properties, we have a unique view into how malicious ads affect sites in different categories. The chart below shows how social media sites were more than twice as likely as the average site to be hit with a security issue. The News and Family & Parenting categories also were standouts when it came to malware risk.
Looking Ahead
Understanding how bad actors work and how they exploit the ad tech ecosystem allows the industry at large to stay ahead.
With a strong feedback loop across the supply chain, from DSP to SSP to publisher, we are able to capture the data necessary to track and pinpoint malvertiser attacks, keeping our partners informed and protected.
Stay tuned for our next blog post as we cover SSPs performance over the last quarter.
