David Lim • 2 minute read
We recently published a blog post on where attacks occurred in Q1 2020, looking at which countries were targeted, which browsers and operating systems were most vulnerable, and what site categories were of interest to Malvertisers. In this blog post, we’ll dive a bit deeper into the supply chain and look into the SSPs that were impacted with problematic ads in Q1.
Key Takeaways
- A big gap remains in performance among the top SSPs
- When under sustained attack, SSPs had days when 2-4 of every 100 impressions were malicious
- The biggest SSPs aren’t necessarily the cleanest —we found no correlation between the number of impressions an SSP delivers and their violation rates.
With our unique position in the industry, we are able to capture real-time impression data from over 75 SSPs. Of these, a mere 13 SSPs represent 75% of total impressions. We note these providers in the charts below using a coding system that carries over from quarter to quarter. So without further ado, let’s take a look at the performance of top SSPs.

Performance of Top SSPs
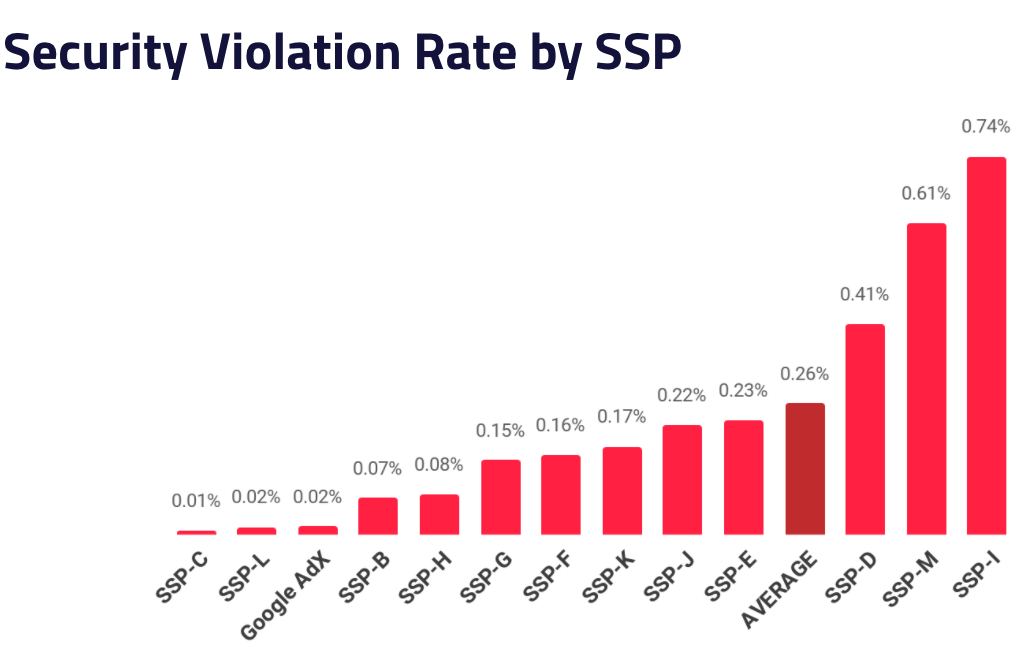
To start off, we’ve identified Google Ad Exchange in our charts because they operate the largest exchange and have access to data and resources beyond what’s available to other exchanges. Unfortunately, although Google is considered the gold standard, even they are susceptible to malicious attacks. They fell from 1st place in 2019 to 3rd place so far this year when it comes to security violation rates. However, it’s not all bad news. SSP-C saw a huge improvement from Q4 2019 to Q1 2020 with 0.26% reduction in security violations, putting them at 1st place. Overall, we continue to see huge gaps in performance among SSPs with SSP-I delivering malicious ads at over 100x the rate of the best.
Understanding the security violation rate for each SSP is important as it provides an estimated probability of an impression being served with a security issue, but we can’t forget about the significant variations in day-to-day performance as well.
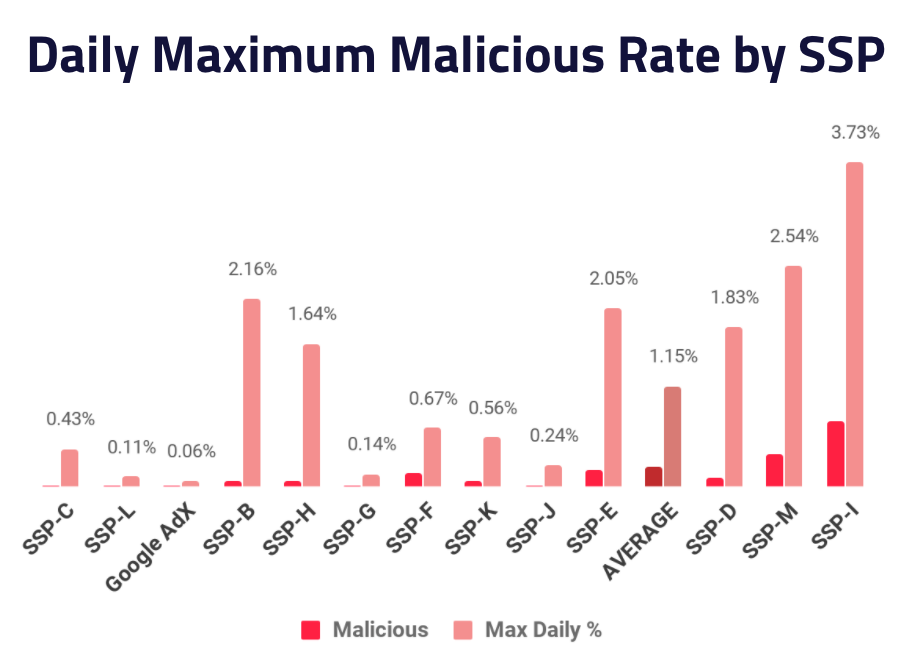
Peak attacks from a malvertiser can do serious damage to an SSP For example, we estimate FizzCore nets up to $1M a day by exploiting the adtech ecosystem. This is why it is critical to measure the daily maximum malicious ad rate for each SSP to get a sense of risk. When under sustained attack, we saw SSPs had days when close to 4 of every 100 impressions were malicious, putting publishers at considerable risk.
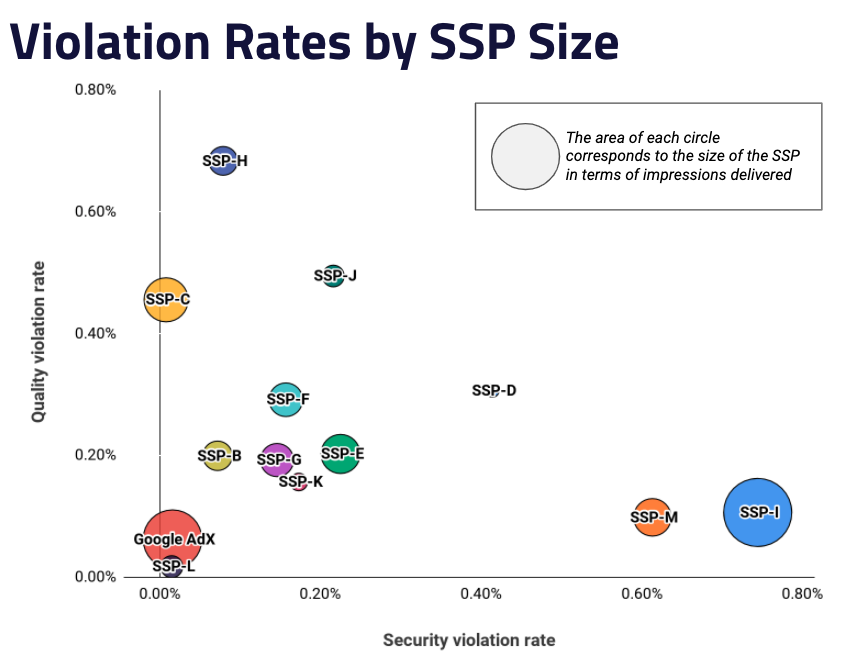
Many have asked us, “does size matter?” with regards to security and quality issues and the number of impressions an SSP delivers to publishers. The new chart below shows the relationship between SSP size (as measured by the number of impressions an SSP delivered to publishers) to violation rates.
As you can see, there is no direct correlation between SSP size and violation rates. The best overall performer, SSP-L, was one of the smallest among the top 13 SSPs we tracked, while the worst performance, SSP-I, was one of the largest SSPs in the sample. This leaves us the question of, how can the industry keep SSPs accountable moving forward?
Keeping SSPs accountable
We cannot emphasize this enough but it takes the whole supply chain to communicate with one another in order to make the digital world safe for everyone. As a great hero of mine once said, “with great insight, comes great responsibility”. We are doing our part in providing both publishers and ad platforms a strong feedback loop to communicate the critical information necessary to improve the overall health of the programmatic ecosystem. If you are curious to learn more or want to know more about these SSPs, please reach out to us.
